This version of the Ed-Fi Dashboards is no longer supported. See the Ed-Fi Technology Version Index for a link to the latest version.
Dashboard Usage Module
Previous Version
This is a previous version of the Ed-Fi Dashboards. Visit the Ed-Fi Tech Docs home page for a link to the current version, or the Ed-Fi Technology Version Index for links to all versions.
Introduction
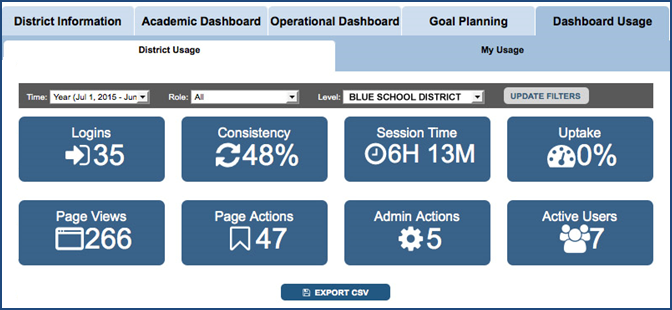
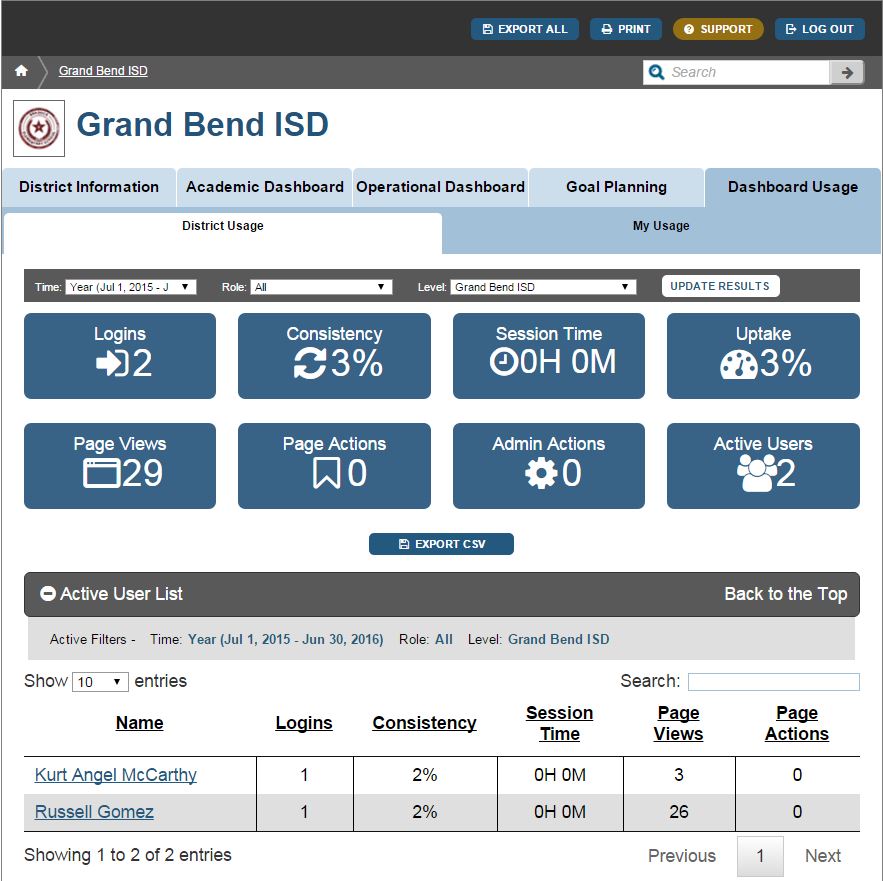
The Ed-Fi Dashboards are a powerful tool for educators, but their impact on student performance outcomes is only as great as their frequent and effective use by educators. The Dashboard Usage Module allows users at all levels of an education organization to view meaningful reports about how the dashboards are being used, and by whom. A view of the interface follows:
This documentation describes the Dashboard Usage Module that has been developed to:
- Track usage of the Ed-Fi Dashboards at an individual level
- Provide usage activity reports at an individual and aggregated level within the Ed-Fi Dashboards
- Support detailed usage analysis via a dimensional model
Getting Started
This section outlines the steps needed to set up and integrate the Dashboard Usage module with Ed-Fi Dashboards v1.4, and assumes that you have successfully followed the Dashboards Getting Started Guide.
Integrating the Dashboard Usage Module into your Dashboards environment can be summarized as:
- Step 1: Configure the Dashboard Usage Module
- Step 2: Verify that the Usage Module tab appears in the Dashboard Application
- Step 3: Configure and Run the Dashboard Usage ETL Console Application
- Step 4: Verify that Usage Statistics Appear in the Dashboard Application
Step 1: Configure the Dashboard Usage Module
Get the Dashboard Usage Plugin Code
The Dashboard Usage plugin code is provided in a ZIP file called Ed-Fi-Dashboards-Plugin-Usage.zip in the Ed-Fi-Samples\Core Plugin Artifacts repository. This ZIP file should be extracted to the same directory where the code for Ed-Fi-Core is located. For example, if the Ed-Fi-Core code directory lives at C:\Ed-Fi-Core, then the Dashboard Usage plugin code should be extracted to C:\Ed-Fi-Dashboards-Plugins-Usage.
Configure the Dashboard Solution
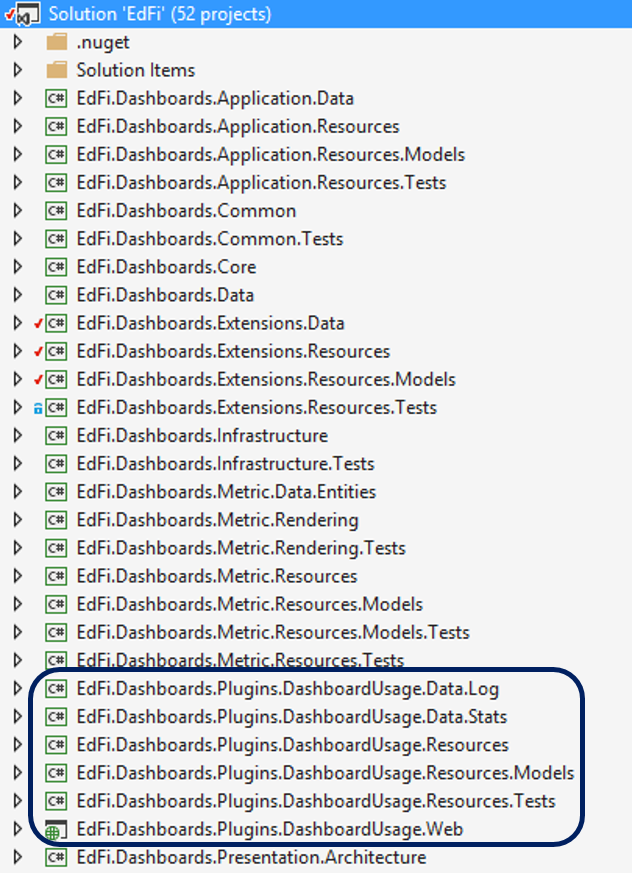
Add the Dashboard Usage plugin projects into the Ed-Fi Dashboard solution. Right-click the Ed-Fi solution file, choose Add > Existing Project, and add each of the six projects in the C:\Ed-Fi-Dashboards-Plugins-Usage\DashboardUsage\Application folder.
- Add two additional connection strings to the
<connectionStrings>section of the Web.config file in the Presentation.Web project.
<add name="DashboardUsageLog" connectionString="Data Source=.; database=DashboardUsageLog; Persist Security Info=True; User Id=edfiPService; Password=edfiPService;" providerName="System.Data.SqlClient" />
<add name="DashboardUsageStats" connectionString="Data Source=.; database=DashboardUsageStats; Persist Security Info=True; User Id=edfiPService; Password=edfiPService;" providerName="System.Data.SqlClient" />
Configure Dashboard Usage Databases
DashboardUsageLog Database
The transactional event log that stores dashboard usage events is stored in a new database called Dashboard Usage Log.
You can deploy the DashboardUsageLog database using one of the approaches described below:
- Create a new database called "DashboardUsageLog" and apply the SQL scripts located at: C:\Ed-Fi-Dashboards-Plugin-Usage\Database\Structure\DashboardUsageLog in numerical order.
Open and publish the database project located at C:\Ed-Fi-Dashboards-Plugin-Usage\DashboardUsage\DatabaseProjects\DashboardUsage\DashboardUsageLog.
DashboardUsageStats Database
The dashboard usage module uses a dimensional model to provide extensibility and flexibility for reporting, as well as addressing performance considerations for the large amounts of usage data that may be captured. The dimensional model is a traditional star schema with facts and dimension tables, provided in a separate database called DashboardUsageStats. This database is written to whenever the DashboardUsage ETL console application runs and processes records from the DashboardUsageLog database.
You can deploy the DashboardUsageStats database using one of the approaches described below:
- Create a new database called "DashboardUsageStats" and apply the SQL scripts located at: C:\Ed-Fi-Dashboards-Plugin-Usage\Database\Structure\DashboardUsageStats in numerical order.
Open and publish the database project located at C:\Ed-Fi-Dashboards-Plugin-Usage\DashboardUsage\DatabaseProjects\DashboardUsage\DashboardUsageStats.
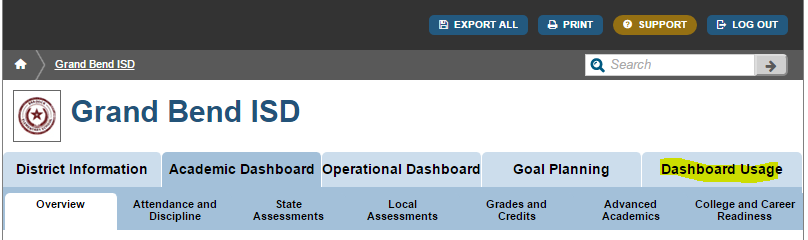
Step 2: Verify that the Usage Module tab appears in the Dashboard Application
The Dashboard Usage module creates a new Dashboard Usage tab at each level: District, School, and Individual User.
- Build and run the Dashboard application and log in.
- Verify that the Dashboard Usage Tab appears in the UI. At this point, we're just validating that the Usage Module is installed. Usage statistics will not be populated until you configure the Dashboard Usage ETL agent in the next step.
Step 3: Configure and Run the Dashboard Usage ETL Console Application
The Dashboard Usage ETL Console Application populates the DashboardUsageStats database from records captured in the DashboardUsageLog database.
- Open the DashboardUsageEtl Visual Studio Solution from C:\Ed-Fi-Dashboard-Plugin-Usage\DashboardUsage\DashboardUsageEtl.
- Review the following settings in the app.config file for the DashboardUsageEtl.Console project, and make changes if needed:
- SessionTimeout. Whenever a user stops interacting with the Dashboard application, or closes the browser without logging out, there is no logout page event recorded for their session. The Dashboard Usage ETL console application detects when this is the case and assigns a value to the time spent on that last page before assuming a user has logged out. The default value of SessionTimeout is 3 minutes.
- QueryActiveDirectoryForUsers. There are currently two implementations of how users are set up in the Dashboard system. One of those implementations uses Active Directory for user role management. For the default Ed-Fi-Alliance implementation (and most other implementations) QueryActiveDirectoryForUsers is set to false. If this setting is set to true, then an initial step will run and retrieve user role information from Active Directory. [1]
Connection strings. There are three connection strings needed to connect to the DashboardUsageLog, DashboardUsageStats, and EdFi_Dashboard databases. These connection strings do not need to be changed if you have followed the Getting Started documentation and are using the as-shipped database names and logins.
<add name="DashboardUsageLogEntities" connectionString="metadata=res://*/DashboardUsageLogModel.csdl|res://*/DashboardUsageLogModel.ssdl|res://*/DashboardUsageLogModel.msl;provider=System.Data.SqlClient;provider connection string="data source=.;initial catalog=DashboardUsageLog;persist security info=True;user id=edfiPService;password=edfiPService;MultipleActiveResultSets=True;App=EntityFramework"" providerName="System.Data.EntityClient" /> <add name="DashboardUsageStatsEntities" connectionString="metadata=res://*/DashboardUsageStatsModel.csdl|res://*/DashboardUsageStatsModel.ssdl|res://*/DashboardUsageStatsModel.msl;provider=System.Data.SqlClient;provider connection string="data source=.;initial catalog=DashboardUsageStats;persist security info=True;user id=edfiPService;password=edfiPService;MultipleActiveResultSets=True;App=EntityFramework"" providerName="System.Data.EntityClient" /> <add name="DashboardEntities" connectionString="metadata=res://*/DashboardModel.csdl|res://*/DashboardModel.ssdl|res://*/DashboardModel.msl;provider=System.Data.SqlClient;provider connection string="data source=.;initial catalog=EdFi_Dashboard;user id=edfiPService;password=edfiPService;MultipleActiveResultSets=True;App=EntityFramework"" providerName="System.Data.EntityClient" />
- After building the solution, open a console window and execute the console program, (i.e., C\Ed-Fi-Dashboard-Plugin-Usage\DashboardUsage\DashboardUsageEtl\DashboardUsageEtl.Console\bin\debug\DashboardUsageEtl.Console.exe)
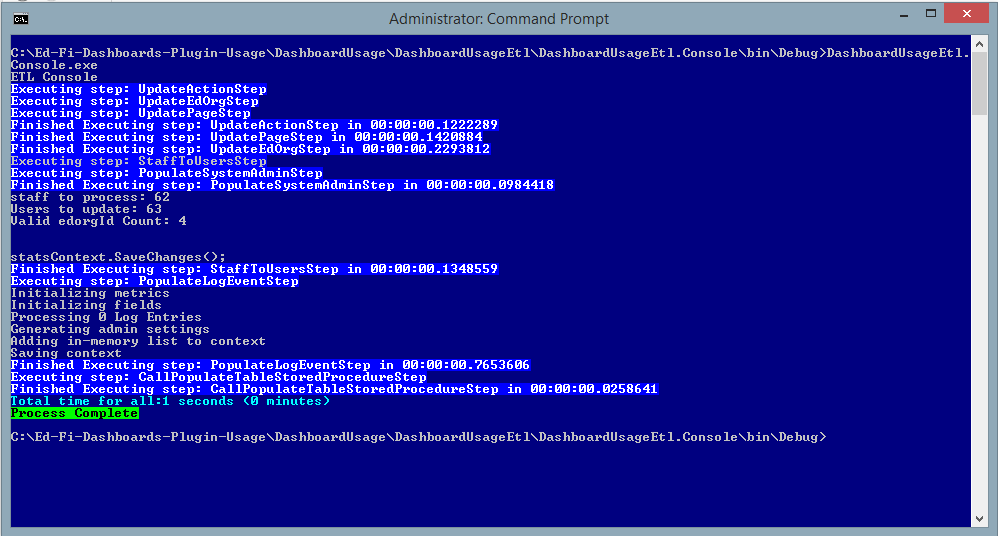
It is recommended that you set up a job to run the Dashboard Usage ETL console application automatically every evening once the solution is deployed to production.
Step 4: Verify that Usage Statistics Appear in the Dashboard Application
Once you have performed the installation steps above, you should be able to see the Dashboard Usage Tab within your Dashboards.
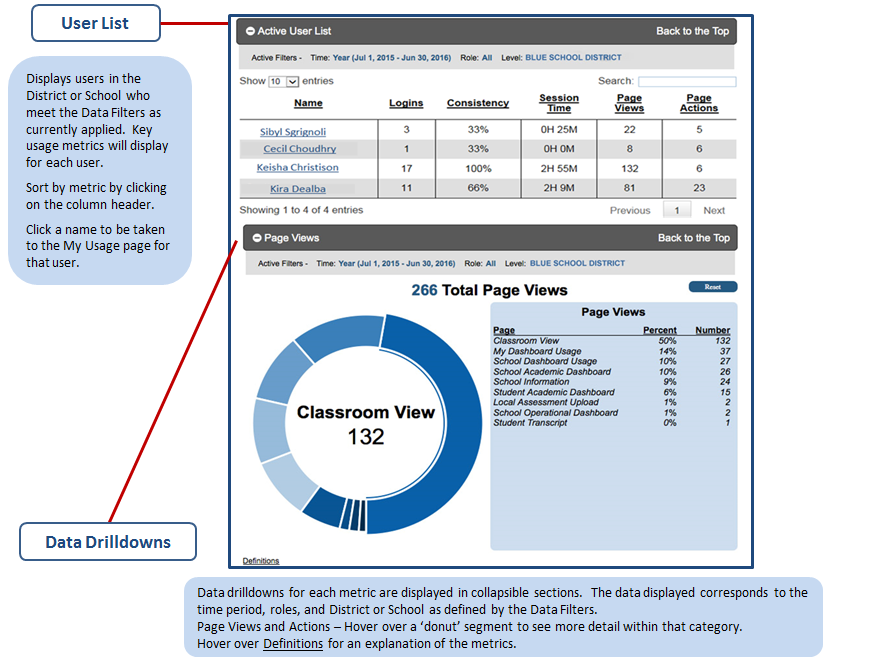
- Each user should see a Dashboard Usage tab.
- Each user should have a My Usage sub-tab that displays their own usage data.
- District and School level administrators with rights to see All Teachers will have a usage subtab that displays the usage information for their LEA or School.
An example of what an LEA level Administrator might see is shown below.
Please note that IIS may cache page data. If you are manually running the Console ETL application, you will need to run iisreset to see the latest data.
Dashboard Usage Reports Overview
The Dashboard Usage module creates a new Dashboard Usage tab at each level: District, School, and Individual User.
The following usage metrics are displayed on the Dashboard Usage pages:
- Logins. Total number of unique logins to the dashboard
- Consistency. % of weeks with at least one login
- Session Time. Total amount of time logged into the system
- Uptake. Active users / Potential users within the school
- Page Views. Total number of unique page views accessed
- Page Actions. Total number of unique actions called
- Administrative Actions. Total count of administrative actions
- Active Users. Total number of Active users in the school
Below is a guide to the functionality and display at a District level view (e.g., for a user with the role of Superintendent).
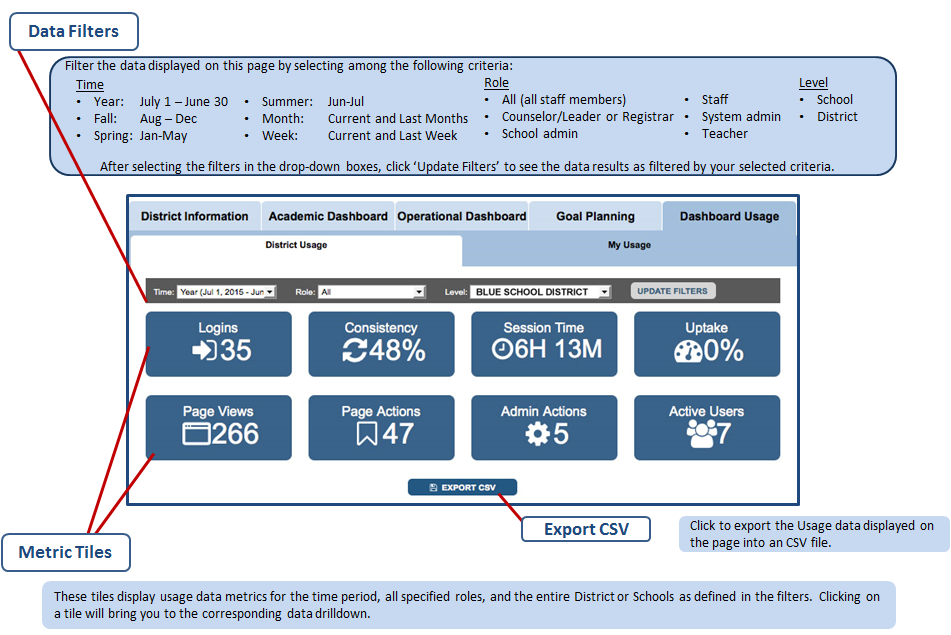
The School user view (e.g., for Principals) is identical to the District level view except there is no filter for level. The Individual user view is identical except there is only a filter for Time Period. Also, some metrics and drilldowns available at the District and School levels are not available at the Individual level.
Technical Information
Solution Overview
The solution architecture consists of three main features:
- Data collection via MVC action filter and event log
- Usage data storage via a dimensional model
- Dashboard usage reports
The diagram below illustrates the architecture:
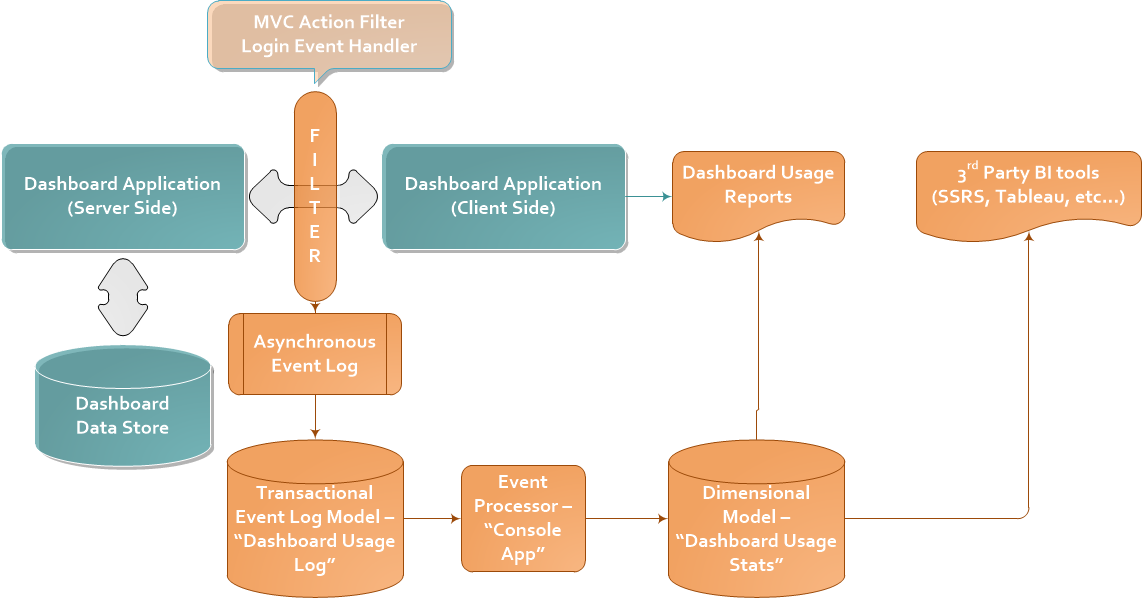
To collect dashboard usage data in real time as users interact with the dashboard application, an MVC action filter (a feature of the Microsoft Model-View-Controller framework) adds a cross-cutting layer that is applied to every server request. At the time of the server request, there is enough context to identify the user making the request and the resource they are requesting. This resource is identified by the route (i.e., the URL path).
An example URL for an LEA named Grand Bend ISD is:
https://localhost/EdFiDashboardDev/Districts/GrandBendISD/Overview
This route is the site-root-relative path portion of the URL, dissected from the current context route data. The route contains data in defined positions in the path, key/value pairs are obtained using those known positions:
LEA=”GrandBendISD”, Page/Resource=”Overview”
The collected contextual information, including any immediate derivations already provided by the dashboard’s framework for other reasons (e.g., LEAId), are stored in a transactional event log table that is optimized for writing. All writes occur in an asynchronous manner to avoid degrading performance of the web application or reducing application responsiveness to user interaction.
A description of the storage and calculation of data and metrics is contained in the Technical Details section that follows.
Adding new Dashboard Tabs, Pages, Actions
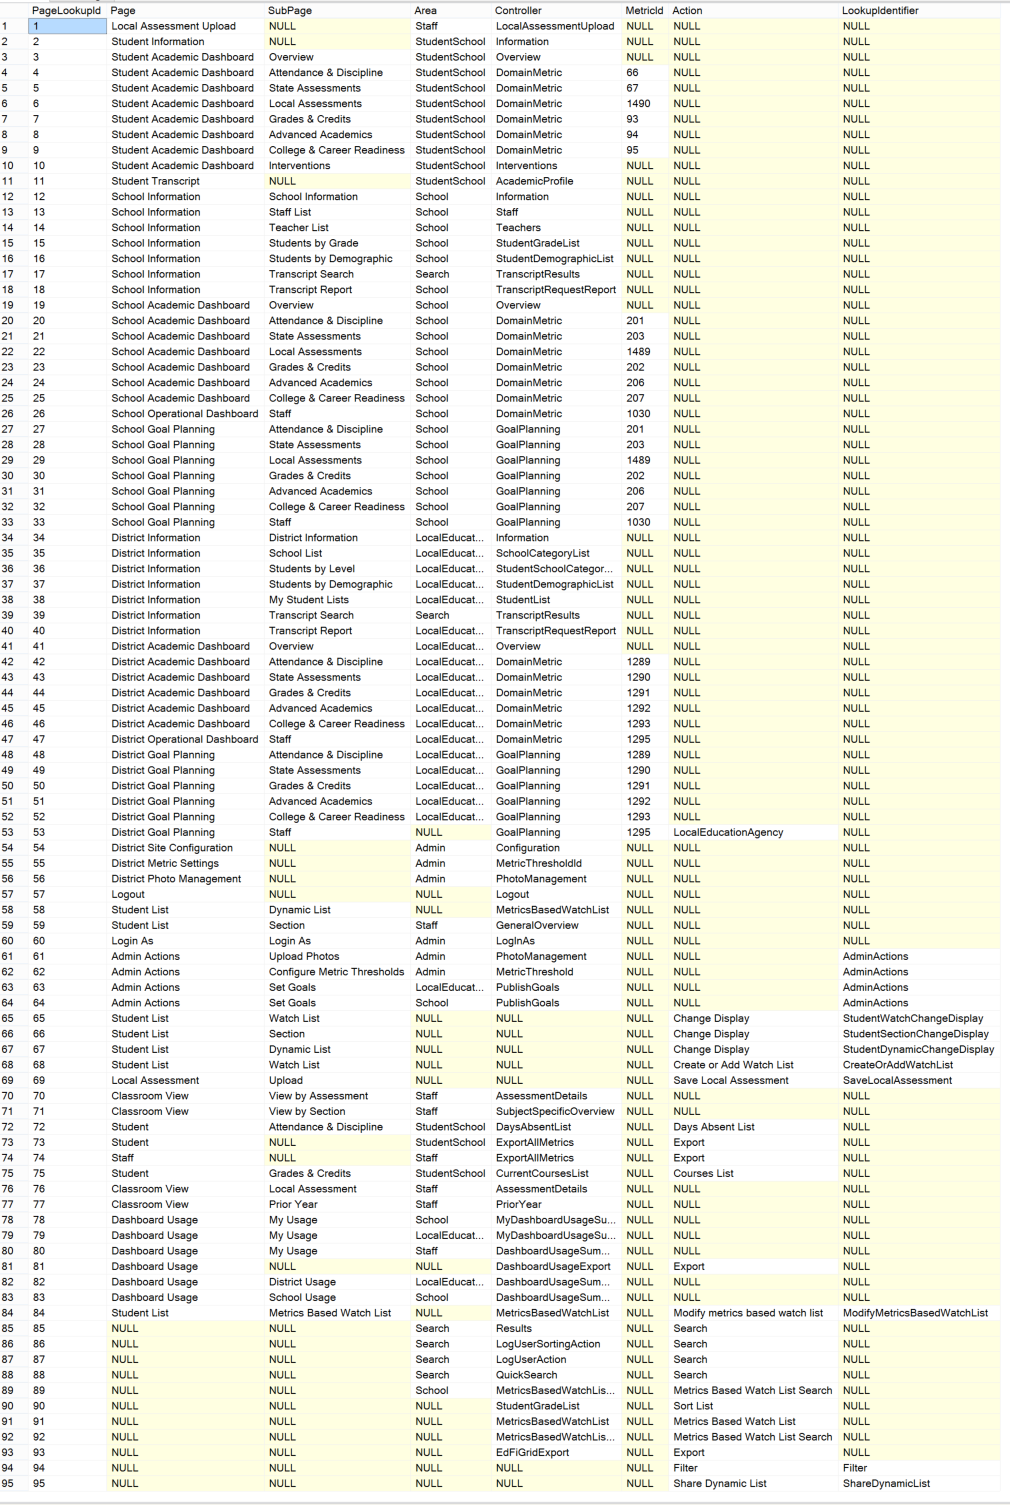
There is one table that has to be manually configured to account for how new additions to the Dashboard are categorized. The table is DashboardUsageStats.Utility.PageLookup.
If one or more rows are added to this table, the Console App will automatically pick up the new information in the next execution.
While the MVC Action Filter will dynamically track all user views and actions, most pages and actions do not inherently have user-friendly names. This table has a pre-populated list of page views and actions based on Core dashboard functionality. Any new types of page views and actions should be added to this table to enable a user-friendly display on the reporting page, as well as any categorization of these page views and actions.
For instance, the Dashboard reporting shows all high-level tabs as high-level categories, and the sub-tabs as page views within those categories. If a new tab is created within the Dashboard, the usage of this tab will be tracked and reported, but it will not have any reference as to categorization, and it may have a non-user-friendly name. Without this information, all pages that are not metrics or part of a small set of custom conditions would have a name of Unknown.
One reason one may want to modify this table is to change the display name of a Page, SubPage, or Action. Another reason to add to this table is if, for example, there are custom pages added through extension or plugin code that one wants to include in their usage statistics. In that case, after visiting the page, the dashboardUsageLog database would need to be consulted, find the event log that was triggered, and notice the unique characteristics about the route, such as whether it had a MetricId, and what Controller in what Area was viewed. With this information, add a row and give the event log identity through the Page, SubPage, and Action columns. Below is a screen shot of the default data:
Integration with Security
Available roles need to be matched with users as identified in the Ed-Fi Dashboard table domain.StaffEducationOrgInformation.
Users will not be counted for Dashboard Usage if any of these conditions exist:
- The user does not exist in domain.StaffEducationOrgInformation
- The user does not exist in domain.StaffInformation
- The user does not exist in extension.StaffExtension
- Active Directory integration is being used and the user is not set up in Active Directory (can be modified based on security system used in the particular implementation)
Exporting Aggregate Data for SEA and Third-Party Consumption
To satisfy the need of SEA and other external data reporting needs, views of aggregate level data have been created with export capability.
Export values include data by role for the current year and prior month for the following data points:
- Number of Active Users
- Number of Potential Users
- Uptake
- Consistency
- Logins – Total
- Logins per unique Active user – Maximum, Mean, Median, and Minimum
- Page Views – Total
- Page Views per unique Active user – Maximum, Mean, Median, and Minimum
The procedure to run the export process is as follows:
- Open SQLServer Management Studio (SSMS)
- This operation will require execute rights on the Dashboard databases
- On the menu select Tools > Options
- In the Options window select QueryResults > SQL Server > Results to Grid
- It should like the screenshot below:
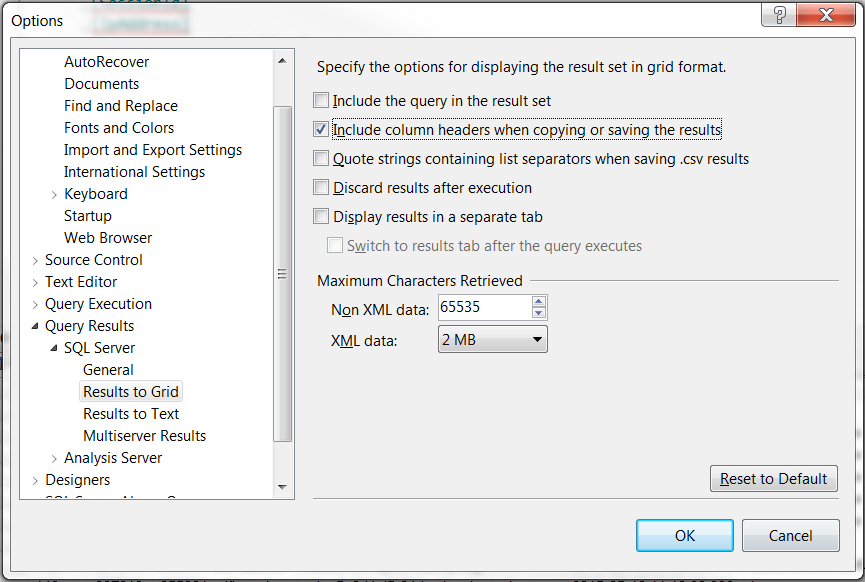
- It should like the screenshot below:
- Make sure the box to “Include column headers when copying or saving the results” is checked, then click OK
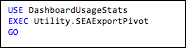
- Execute the stored procedure called “SEAExportPivot” by typing the following lines in a new query window:
- Wait. Seriously, this process may take up to ten minutes
- When results return, right click in the upper left of the grid and select Save Results As...
- Type a filename and format as prompted by the pop-up Save window
- Alternately, when results return, select Copy with Headers and then paste directly into a blank Excel spreadsheet
Once exported to Excel as shown in Figure 1, the data can be reformatted and analyzed as the user intends.
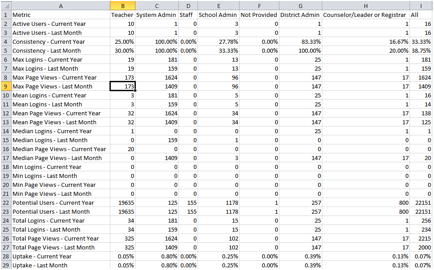
Figure 1. Sample export as viewed in Excel
Reporting Examples
Included below are some sample scripts that may be used to create additional views for Dashboard Usage reports, or to query existing views. The scripts are a variety of illustrative examples for how the dimensional model can be queried. Guidelines follow for best practices such as how to avoid duplication of data and other pitfalls.
Sample Scripts
Sample 1. Find all user sessions less than one minute long.
SELECT 	[SessionId]
		,[SessionBeginDateTime]
		,[DurationSeconds]
		,[StaffUSI]
		,[LoginRole]
		,[UserDistrict]
		,[UserSchool]
FROM [DashboardUsageStats].[Session]
WHERE [DurationSeconds] < 60
Sample 2. Return all Page View Events for a time period not available in the dropdown.
SELECT 	[LogEventId]
		,[SessionId]
		,[EventType]
		,[StaffUSI]
		,[LoginRole]
		,[Page]
		,[SubPage]
		,[DatePeriod]
		,[EventDateTime]
FROM [DashboardUsageStats].[LogEvent] le
INNER JOIN [DashboardUsageStats].[DimDatePeriod] dip
	ON le.[DateId] BETWEEN ddp.[BeginDateId] AND [ddp.EndDateId]
WHERE le.[EventType] = 'Page View' and ddp.[DatePeriod] = 'May 2014'
Sample 3. Find all logged events for a given user on Saturdays or Sundays.
SELECT 	fle.[SessionId]
		,det.[EventType]
		,dlu.[StaffUSI]
		,da.[Action]
		,dp.[Page]
		,dp.[SubPage]
		,fle.[ActionRouteDetail]
		,dd.[LongDayOfWeek]
		,fle.[EventDateTime]
FROM DashboardUsageStats.[FactLogEvent] file
INNER JOIN DashboardUsageStats.[DimLoginUser] dlu ON fle.[LoginUserId] = dlu.[LoginUserId]
INNER JOIN DashboardUsageStats.[DimDate] dd ON fle.[DateId] = dd.[DateId]
INNER JOIN DashboardUsageStats.[DimEventType] det ON fle.[EventTypeId] = det.[EventTypeId]
INNER JOIN DashboardUsageStats.[DimAction] da ON fle.[ActionId] = da.[ActionId] INNER JOIN DashboardUsageStats.[DimPage] dp ON fle.[PageId] = dp.[PageId]
WHERE dd.[IsWeekEnd] = 1 and dlu.[StaffUSI] = 207227
Sample 4. Building on Sample 1, what percent of each user’s total were under one minute?
SELECT 	SUM(case when fs.[DurationSeconds] < 60 then 1 else 0 end) as ShortSessions
		,count(fs.[SessionId]) as TotalSessions
		,100.00 * SUM(case when [DurationSeconds] < 60 then 1 else 0 end) / count(fs.[SessionId]) as PercentShort
		,dlu.[StaffUSI]
		,dlr.[LoginRole]
		,de.[District] as UserDistrict
		,de.[School] as UserSchool
FROM [DashboardUsageStats].[FactSession] fs
INNER JOIN [DashboardUsageStats].[DimLoginUser] dlu ON fs.[LoginUserId] = dlu.[LoginUserId]
INNER JOIN [DashboardUsageStats].[DimLoginRole] dlr ON fs.[LoginRoleId] = dlr.[LoginRoleId]
INNER JOIN [DashboardUsageStats].[DimUserEdOrgRole] duer ON fs.[LoginUserId] = duer.[LoginUserId] AND fs.[LoginRoleId] = duer.[LoginRoleId]
INNER JOIN [DashboardUsageStats].[DimEdOrg] de ON duer.[EdOrgId] = de.[EdOrgId]
WHERE dlu.[StaffUSI] <> 0 --filters out the admin account
GROUP BY dlu.[StaffUSI], dlr.[LoginRole], de.[District], de.[School]
ORDER BY StaffUSI
Sample 5. See all Page/Subpage values that have ever been recorded.
SELECT 	[Page], [SubPage]
FROM [DashboardUsageStats].[LogEvent]
GROUP BY [Page] ,[SubPage]
ORDER BY [Page] ,[SubPage]
Query Guidelines
The following points are general guidelines for querying the star schema and pre-created views:
- When designing a query that pulls from the star schema, always start with one of the Fact tables and branch out to pull in the Dimension (Dim) tables. Even if all the information you want is in one dimension table, starting there may return orphaned records that are no longer valid.
- Avoid going three levels (or more) deep when creating views. In other words, don’t create view C that pulls from view B, when view B pulls from view A. This can cause SQL Server optimization and performance issues.
- The Session and LogEvent views are designed to be generally useful, only filtering out admin actions. These are great starting points for new views.
- To filter out admin records, use
WHERE StaffUSI <> 0when starting from either FactLogEvent or FactLogSession. - Filtering (or joining) on Dates and Times is easier, more accurate, and more performant when using the DimDate and DimTimeOfDay dimension tables rather than relying on the EventDateTime and/or SessionBeginDateTime columns themselves.
- Optimizations have been done based on existing views and queries from the Dashboard Usage Tab and exports. If new queries are run regularly (not ad hoc) then additional indexes may be needed. Care and testing should be undertaken when doing so however, as new indexes may adversely affect existing queries.
[1] This is currently an Arkansas-specific implementation so if you actually do have your system set up this way you may need to modify the code in ActiveDirectoryRoleGroupProvider.cs, modifying the PrincipalContext to point to the correct Domain.
In this article: