Early Warning System Collection
Overview
The Early Warning System fact views are based on the Balfanz, et al., model for early warning, they calculate metrics and risk factors based on four criteria:
- Attendance
- Behavior
- Course Performance in English
- Course Performance in Math
For more information on this approach to early warning systems, see On Track for Success: The Use of Early Warning Indicator and Intervention Systems to Build a Grad Nation.
Views in this Collection
The data model contains two fact tables with different date dimensions: StudentSectionGradeFact represents a grade assigned to a date range (grading period), and StudentEarlyWarningFact brings together attendance and behavior information on a daily basis. Also see Dimensional Views for more information on the other views in this model.
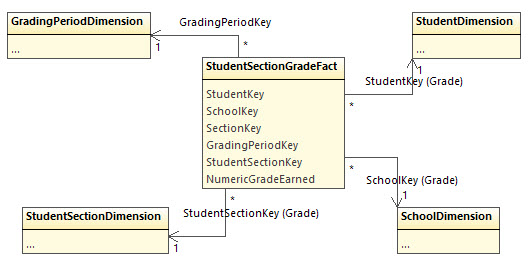
The StudentSectionGradeFact view provides raw data for course performance: the grade earned for a student in a section during a grading period. It only provides this information for grades of type "grading period", which is the most granular available per grading period — typically a unit smaller than a trimester or semester.
The fact tables do not support the gradebook for two reasons. First, there are too many ways to calculate total grade from gradebook entries. Second, field experience shows that Ed-Fi implementations are much more likely to populate the Grade table (by grading period) than the GradeBookEntry (which contains homework, quiz, and test grades).
While there is no independent Section view, the SectionKey value may be critical for user data authorization.
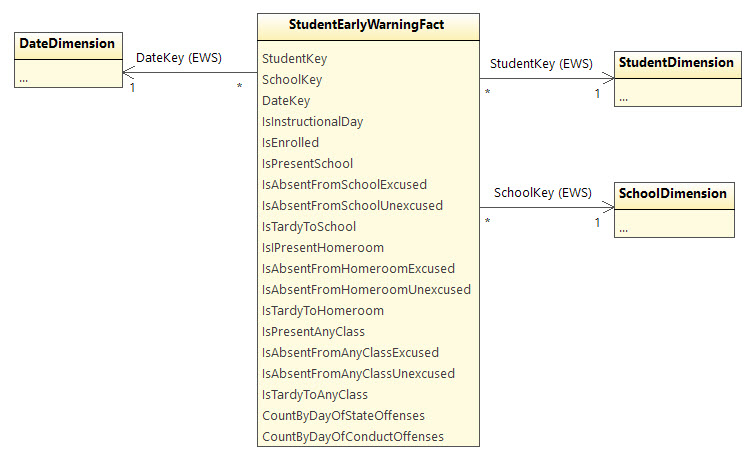
The early warning attendance and behavior data are supplied by StudentEarlyWarningFact, using three key fields: Student, School, Date. The SchoolKey supports students who might be dual-enrolled and it may be used for user data authorization.
Attendance rates will not be pre-calculated due to the variation in business rules. Instead, the view provides multiple views on attendance, with data from two different perspectives:
- Attendance indicators
- Tardy
- Excused Absence
- Unexcused Absence
- Present
- Attendance scope
- Homeroom
- Any Class
- School
Which factors are used for calculating attendance depends on the school and on how attendance is recorded in the source systems. Some systems may record attendance in the positive sense (student is present), while others might only record when the student is absent or late.
The behavior fields provide counts of infractions per day. Not all behavior incidents are recorded here, only those marked as a "state offense" or as a "code of conduct violation."
Installation
Install using the option code "EWS"
.\EdFi.AnalyticsMiddleTier.Console.exe -c "..." -o EWS
For more information, see the AMT Deployment Guide.
Configuration
If your schools use letter grades instead of numeric grades, in some or all cases, then you may wish to review the default mapping from letter to numeric grades as used by the StudentSectionGradeFact view in the Early Warning System collection.
This mapping is provided so that analyses can run aggregate calculations over numeric values that would not otherwise be available. Modify or add rows as needed to the [analytics_config].[LetterGradeTranslation]. Default values are:
Letter | Numeric |
|---|---|
| A | 95.0 |
| B | 85.0 |
| C | 75.0 |
| D | 65.0 |
| F | 55.0 |
That is, a grade of A will be treated a 95.0, a grade of B will be treated as 85.0, and so forth.
Sample Scripts
The source code repository contains a number of sample scripts in the samples directory.
These are true samples that are not designed to any universal specification or requirement. Please evaluate carefully before relying on them.
Analytics Queries
These scripts include examples that perform detailed calculations of the type that might normally be handled in an analytics engine, such as SQL Server Analysis Services.
| File | Description |
|---|---|
| AttendanceTrend.sql | Calculates an attendance rate for each student. This uses the EWS collection; there are other sample scripts for the Chronic Absenteeism Collection |
| EnrolledSections.sql | Calculates the current grade for a section as an average across the StudentSectionGradeFact |
| RiskIndicators.sql | Contains three different queries to calculate the "risk level" for each of the three components of the early warning system. |
| StudentGradeByGradingPeriod.sql | Calculate a student's average grade across all sections, or restore commented-out code to calculate only across Mathematics or English Language Arts classes. |
As noted in On Track for Success, "Local factors and policies also play a role in determining the cut points" (p15). The at-risk and early-warning thresholds used in these samples may or may not be appropriate for a given district or state. Furthermore, the calculations themselves might not be meaningful in all situations. For example, the attendance model might be too simplistic. Please review the following notes for important details on the algorithms.
Attendance
These scripts assume that the district tracks absence rather than presence. They count a student as absent whether the absence was excused or unexcused. Some schools will record attendance at the school scope, whereas others look at the student's attendance at a designated "homeroom" or require attendance in all classes.
These scripts assume that student attendance might be tracked for either a homeroom or at the school level. From this we can build up the logic as follows:
Number of Days Enrolled := number of instructional or make-up days on which
the student is enrolled at a school.

Number of Days Absent := number of days on which the student is marked as
absent (excused or unexcused) in either the school or classroom.

Attendance Rate := during a range of dates, (Σ Enrolled - Σ Absent) / (Σ Enrolled)
This calculation can be seen in AttendanceTrend.sql, RiskIndicators.sql, and EwsViews.sql. The latter two scripts treat 80% attendance as "at risk" (for dropout) and 88% as an early warning. These thresholds are easy to adjust in the scripts.
Behavior
The presence of any state offense is assumed to indicate that the student is at risk, whereas for code of conduct violations the threshold is set at five offenses for at risk and two offenses for early warning. These calculations are simple counts accumulating over time.
Course Performance
Course performance is evaluated for both English and Math classes. For English, three course subjects (as recorded in the ODS) are considered together: English Language Arts, Reading, and Writing. From this we can build up the logic as follows:
English Grade := during a grading period, the average of grades earned in sections with Subject of English Language Arts, Reading, or Writing.

Math Grade := during a grading period, the average of grades earned in sections with Subject of Mathematics.
These calculations can be see in StudentGradeByGradingPeriod.sql, RiskIndicators.sql, and EwsViews.sql (in the sample scripts). The EnrolledSections.sql script simply provides the grade for any given section. These results in themselves are not considered part of the early warning system; however, they may be useful for display to end-users who want to know detail about failing grades.
Where these queries provide a risk assessment, they treat a student with a grade below 65.0 in either Math or English classes as at risk, and they provide an early warning flag for a grade below 72.0.
Data Mart
As noted in Limiting Impact on the Production ODS, running analytics queries over these views can have a negative impact on the overall database performance. A "data mart" solution was developed for the /wiki/spaces/EXCHANGE/pages/22487683, which exports the view results out to tables. Once tables are created, indexes can be applied for significant performance improvement.
The script AMT-DataMart.sql uses a multi-step approach in order to keep a high level of performance while minimizing downtime. The latter two steps may look severe, but are nearly instantaneous.
- Copy the view results to a temporary "staging" table
- Add indexes to the temporary table.
- Drop any existing materialized tables.
- Rename the temporary tables so that they are now the real tables.