The Ed-Fi “Classic Dashboards” are no longer supported through the Ed-Fi Alliance. You can still receive support and maintenance through the Ed-Fi vendor community. Please look at any of the vendors’ dashboard solutions on the Registry of Ed-Fi Badges or the Ed-Fi Starter Kits if you are looking for a visualization solution to use with the Ed-Fi ODS. This documentation will remain available to assist existing Classic Dashboard implementers.
UI Developers' Guide - Architecture Detail
This section builds upon the Dashboard Architecture Pattern Overview, providing implementation detail and other specifics useful to understanding and working with the Ed-Fi Dashboards application.
Request Handling
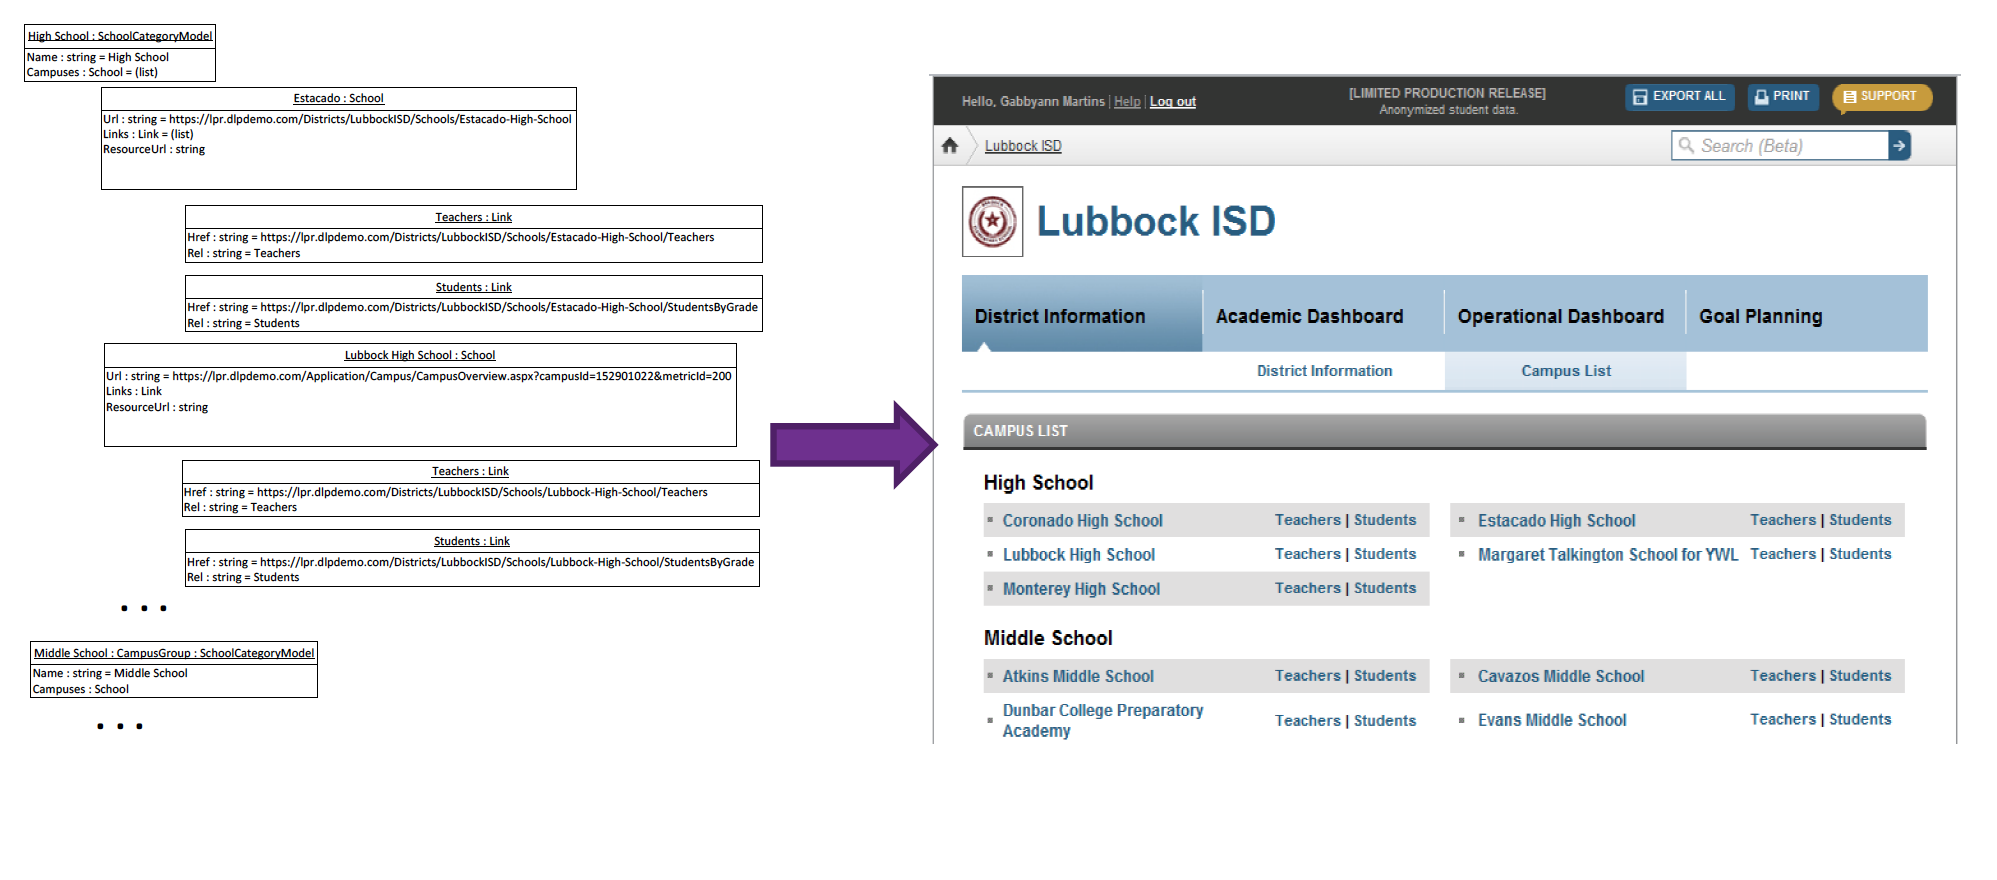
The figure below shows an end-to-end slice for the School Category List, which is a page for the Local Education Agency that shows all of its schools, grouped by category (e.g., elementary, middle school, high school).
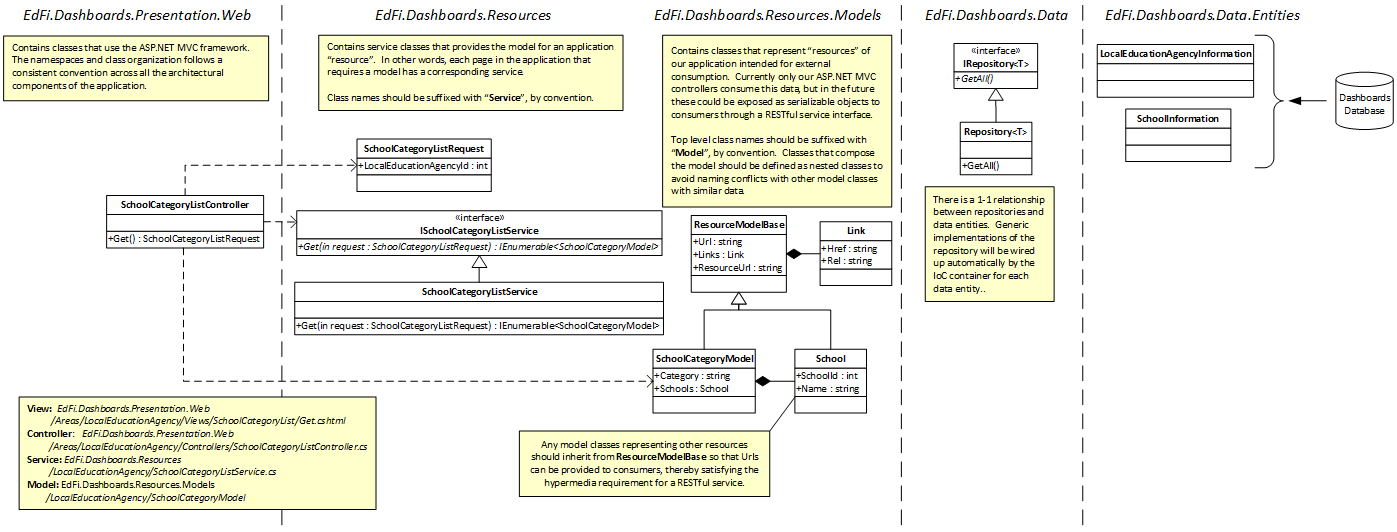
The figure above shows an end-to-end slice for the School Category List, which is a page for the Local Education Agency that shows all of its schools, grouped by category (e.g., elementary, middle school, high school). The following list describes the steps involved in receiving a request for the web page to the point of rendering a web page.
- A logged-in user makes a request to https://ourwebsite.org/GrandBendISD/SchoolCategoryList.
- The URL is matched to the LocalEducationAgency_Resources route as registered in the LocalEducationAgencyAreaRegistration class.
- The explicit controller implementation SchoolCategoryListController is found by ASP.NET MVC using default conventions, and the Get action is invoked.
The ASP.NET MVC model binder translates the route values (the Local Education Agency Id in this case) into an instance of the SchoolCategoryListRequest class which is the parameter needed to invoke the Get action method on the SchoolCategoryListController. This request object is the same request needed for the call to the service.
If no explicit controller implementation is provided, the EdFiControllerFactory implementation will attempt to identify the service for the requested resource by convention. If it finds a matching service, it will use a generic passthrough controller to call the service and initiate rendering of the view. If no special behavior needs to be added in order to render the view for a particular resource, the controller implementation is optional.
- The controller invokes the Get method of the ISchoolCategoryListService implementation.
- The SchoolCategoryListService class uses the injected IRepository<SchoolInformation> and IRepository<SchoolGradePopulation> implementations to construct a query that retrieves the necessary data to populate and return a collection of SchoolCategoryModel objects.
- The SchoolCategoryListController returns a View action result with the model returned by the service.
- ASP.NET MVC finds the appropriate view based on conventions and renders the web page.
Loading Dashboards Data into C# Entity Objects
To make the application data accessible to the C# Presentation Services layer, the SubSonic data access framework was used (see http://subsonic.github.io). The framework provides code generation templates for use with the T4 engine included with Visual Studio to create classes for each table as shown in the image below.
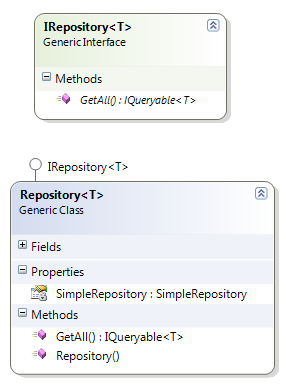
The application uses the Generic Repository pattern to provide access to data. Rather than build custom repository methods for extracting data, the Generic Repository provides the application developer with access to tables via an IRepository<T> generic interface. The repository object is instantiated for a specific entity (i.e., database table), and then LINQ-based queries are formed using the IQueryable<T> returned by the GetAll method. The SubSonic SimpleRepository class translates the LINQ query expressions into SQL for execution.
Preparing C# View Models from Data Entities
Sometimes the results of the queries performed in Step 6 (above) can be transformed directly into view model classes that are ready for use in rendering web pages. The following method shows the simple construction of a view model object directly from a LINQ query for the categorized school list for a local education agency:
public IList<SchoolCategoryModel> Get(SchoolCategoryListRequest listRequest)
{
    var listContext = uniqueListIdProvider.GetUniqueId();
    var results = (from data in repository.GetAll()
        where data.LocalEducationAgencyId == listRequest.LocalEducationAgencyId &&
            schoolGradePopulationRepository.GetAll()
            .Select(o => o.SchoolId).Contains(data.SchoolId)
            select data).ToList();
        var schoolCategories = results.GroupBy(x => x.SchoolCategory).OrderBy(y => y.Key,
            new SchoolCategoryComparer(schoolCategoryProvider));

        return (from schoolCategory in schoolCategories
            select new SchoolCategoryModel
            {
                Category = schoolCategory.Key == ungraded ? other : schoolCategory.Key,
                    Schools =
                        (from c1 in schoolCategory
                            orderby c1.Name
                            select new SchoolCategoryModel.School
                            {
                                SchoolId = c1.SchoolId,
                                Name = c1.Name,
                                Url = schoolLinks.Default(c1.SchoolId, c1.Name).AppendParameters("listContext=" + listContext),
                                Links = new List<Link> {
                                    new Link {
                                        Rel = students,
                                        Href = schoolLinks.StudentsByGrade(c1.SchoolId, c1.Name)
                                            .AppendParameters("listContext=" + listContext).Resolve() },
                                    new Link {
                                        Rel = teachers,
                                        Href = schoolLinks.Teachers(c1.SchoolId, c1.Name)
                                        .AppendParameters("listContext=" + listContext).Resolve() }
                                }
                            }
                        )
                    }
                )
            }
        ).ToList();
}
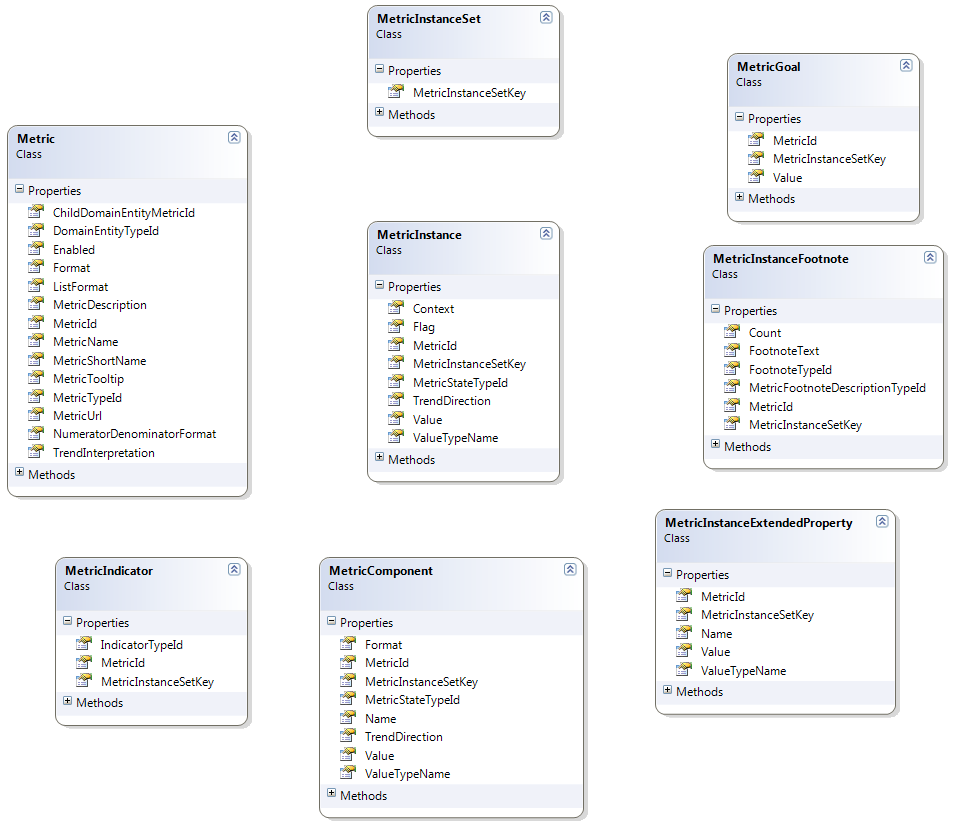
However, for other view models such as the one used for rendering the metric views, more preparation is needed. The MetricInstanceTreeFactory class combines the metric metadata and metric values into a hierarchical metric instance view model for use in rendering the user interface (discussed in detail below).
Rendering Web Pages Using View Models
This section provides detail about the view models used in rendering pages.
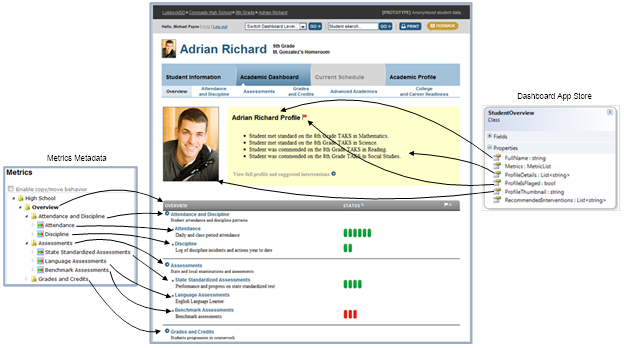
Metric Metadata Management
The metrics are organized into a logical hierarchy and are generally managed by the development team using a separate application. The figure below shows a partial screen shot of this management application, how the high school metrics are organized, and the web page rendered using this metadata. As you can see, the metadata hierarchy is used to drive both the navigation menus and the metric content on the page. The data for a particular student is combined with the hierarchal metadata into view model classes used to render the page with ASP.NET MVC.
ASP.NET Template-Based Rendering
The metric content of the pages is rendered using individual ASP.NET MVC Razor templates (see listings below) by a custom rendering engine that processes the Metric View Model hierarchy. Each metric model class in the hierarchy is matched with an appropriate template based on a number of factors including (but not limited to) the overall rendering context of the page (i.e., “Overview” or “Metric”), the type of the metric (i.e., container, aggregate, or granular), and the depth of the metric in the hierarchy. For example, the overview page shown above renders in a context such that rendering stops once the “aggregate” metrics are rendered.
Contrast that with the figure below where the rendering process starts with the College and Career Readiness “container” metric and continues all the way down to the “granular” metric values.
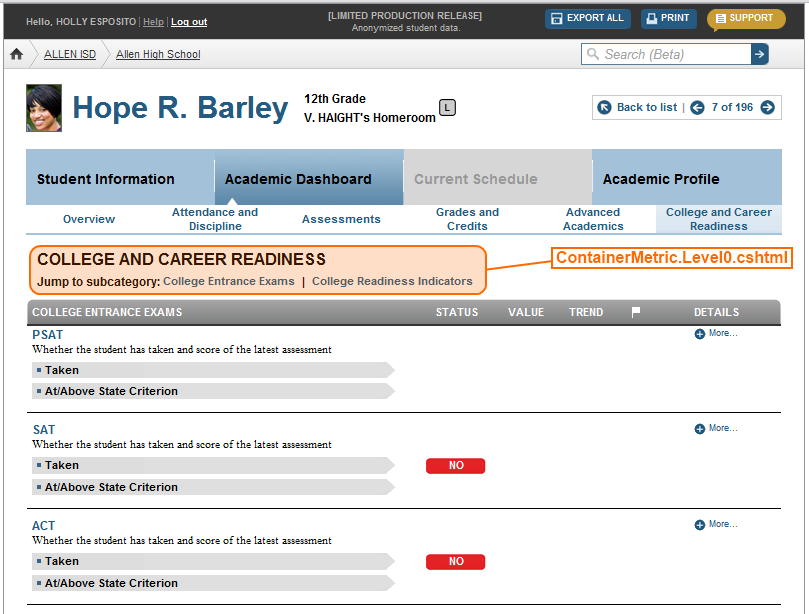
The following listing shows the contents of the ContainerMetric.Level0.cshtml template.
@model ContainerMetric

<tr>
    <td style="height: 23px;" colspan="9">
        <table style="width: 100%;" cellpadding="0" cellspacing="0">
            <tr>
                <td style="width: 10px;">
                </td>
                <td>
                    <span id="vMetricId@(Model.MetricId)" class="metricId PageTitleTextStyle">
                        @(Model.MetricId)
                    </span>
                    <span class="PageTitleTextStyle" style="text-transform: uppercase;">
                        @(Model.Name)
                    </span>
                    <br />
                    <table cellspacing="0" cellpadding="0" border="0">
                        <tbody>
                            <tr>
                                <td style="text-align: left;">
                                    @Html.Partial("JumpToMetricSubcategory", Model.Children)
                                </td>
                            </tr>
                        </tbody>
                    </table>
                </td>
                <td style="text-align: right; vertical-align: top;">
                </td>
            </tr>
        </table>
    </td>
</tr>
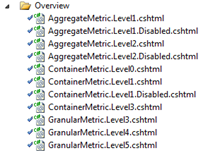
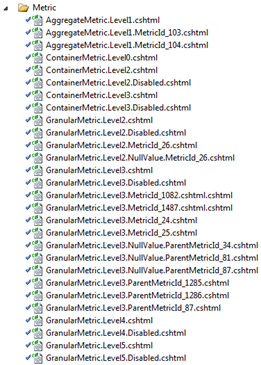
The figure below shows the convention-based naming and organization of the templates for the “Overview” and “Metric” rendering modes. Note that there are templates that provide for a Disabled appearance. Others are “null” value templates which can be used to completely hide a metric by providing an empty template. There are metric-specific templates, and templates for a group of related metrics (via the “ParentMetricId” template value).
The metric rendering engine traverses the hierarchal metric view model and evaluates the context and values of each metric instance to match the appropriate template for rendering.
A more detailed view of the various layers of the user interface code is depicted in the diagram below.