The Ed-Fi “Classic Dashboards” are no longer supported through the Ed-Fi Alliance. You can still receive support and maintenance through the Ed-Fi vendor community. Please look at any of the vendors’ dashboard solutions on the Registry of Ed-Fi Badges or the Ed-Fi Starter Kits if you are looking for a visualization solution to use with the Ed-Fi ODS. This documentation will remain available to assist existing Classic Dashboard implementers.
Metric Configuration Tool - Overview
The Ed-Fi Dashboard Metrics are organized in a hierarchical structure based on Education Organization types (e.g., School, Local Education Agency). The metrics can be managed via directly editing the Ed-Fi Core Dashboard Data Types Metric Metadata CSV files, but this can be challenging and error-prone. The Metric Configuration Tool is a lightweight utility available to manage the logical hierarchy used by the Ed-Fi Dashboards metrics. The tool can be used to review the core, as-shipped metric hierarchy and extend the core metrics by adding new metrics following the core extension principles.
Instructions for deploying this utility on a developer machine can be found in the Metric Configuration Tool - Installation section of this documentation.
Key Concepts
The following concepts are useful to know before diving in:
- Target Users are Business Analysts and Developers. The Metric Configuration Tool is not an end-user facing tool or a tool for advanced dashboard users. It is targeted for use by business analysts and developers.
- Metadata is Local. The Metric Configuration Tool is a web application integrated with the overall Dashboard solution – but does not directly edit the configuration of a production deployment. Instead, it manipulates copies of the Core Dashboard Data Types Metric Metadata CSV files.
- Changes are Applied by the ETL Application. After the CSV files are manipulated, the ETL Application runtime that computes the metrics does the work to apply the metadata changes to a given instance of the Ed-Fi Dashboards. To apply changes you have tested locally to another instance (e.g., if you're intending to update production), you will need access to the directory where the ETL Application loads its configuration values. If you have an integrated build and deployment server, you may need assistance from a DevOps resource.
- Metadata files should be in Source Control. The metadata written by the Metric Configuration Tool has a profound impact on the dashboard metric display and tightly integrates with the ETL Application. This means that the CSV files manipulated by the Metric Configuration Tool should be checked in to source control as if it were code.
With that out of the way, let's look at the tool itself.
Ed-Fi Dashboard Metric Management
The metric display in the Ed-Fi Dashboards are organized into a logical hierarchy. This hierarchical organization is defined by metadata. The metadata is used to drive both the navigation menus and the metric content on the Dashboard pages. The dashboard interface is rendered by combining the dashboard metric data calculated values with the hierarchal metadata into ASP.NET MVC view model classes in the code.
The metric configuration tool handles three tasks: import, export, and edit of CSV files.
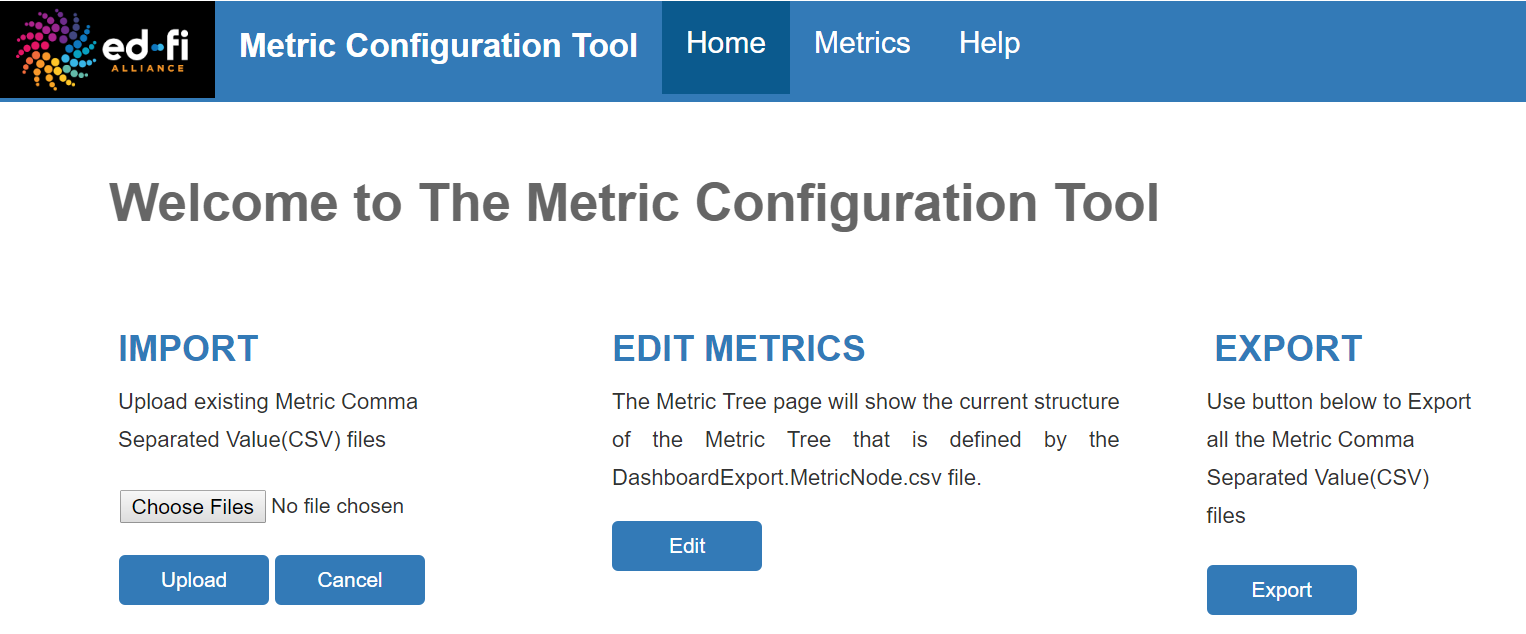
Import
The import option allows user to upload their dashboard type CSV files. The dashboard type files for a core dashboard implementation can be found in the Ed-Fi Dashboards repository.
- ODS v3.2. \Ed-Fi\Etl\src\EdFi.Runtime\Reading\Queries\3.0\DashboardTypes
The tool does not manage versioning or auditing of changes made to these files but they have a profound impact on the system – so we strongly recommended that these dashboard type files are checked in to source control before editing.
Export
Once the files have been edited, we recommend you export the files, replace the original files, and check the updated files into source control. The ETL process will load the files into the metric metadata table and update the UI rendering accordingly. For more details on this process, see the Import Dashboard Types section of this documentation.
Edit
The edit menu allows users to edit, add, and remove metrics. The sections below describe the overall hierarchy and navigation options the tool offers.
Main Metric Hierarchy
The as-shipped, core dashboards are based on a Local Education Agency > Schools > Student hierarchy. Depending on the role of the user, the landing page on the dashboards will be the Local Education Agency Overview (for superintendents), the School Overview (for principals), or the School Teacher View (for teachers). A Student Overview page is the most granular view.

Main Metric Category
The Local Education Agency, School, and Student metric types each contain a main metric category page. This view represents the tabs available in the dashboard for the hierarchy level you are in.
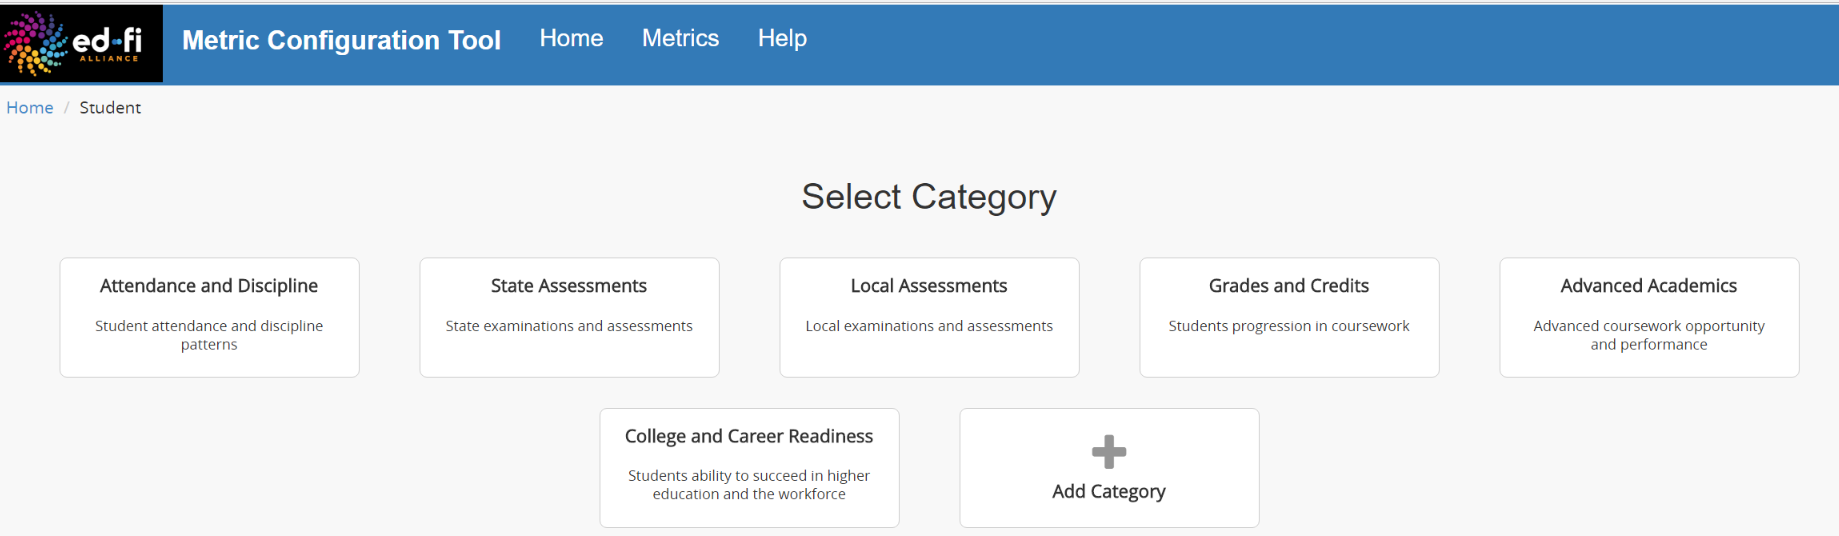
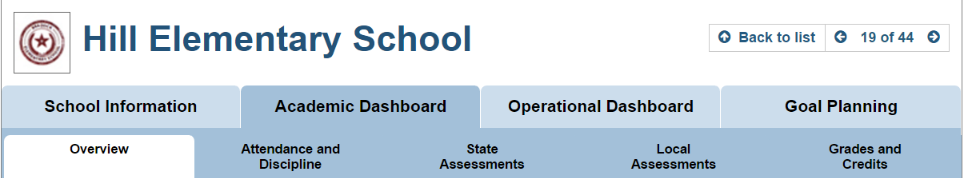
It is important to note that the available categories at the School level might be different based on the school category. For example, the category College and Career Readiness is available at the Local Education Agency (District) level as shown in Figure 1, below. This category is also available at the School High School category (Figure 2) – but it is not available at the School Elementary category (Figure 3) since metrics in this category only apply to high school grade levels.
Figure 1. District - College and Career Readiness Category
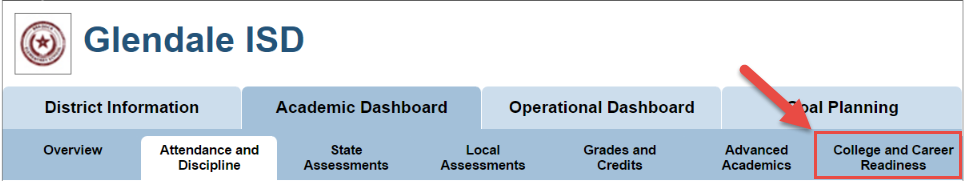
Figure 2. High School - College and Career Readiness Category
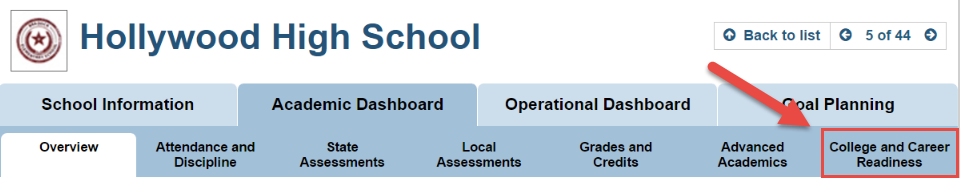
Figure 3. Elementary School Categories
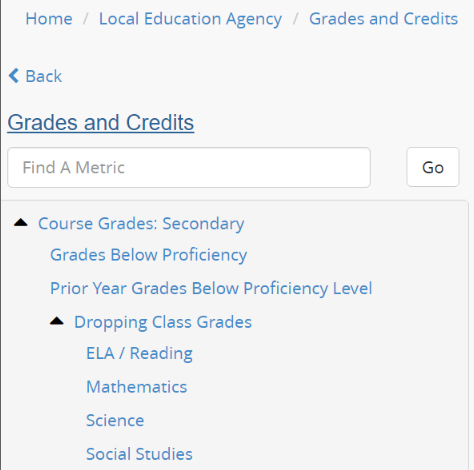
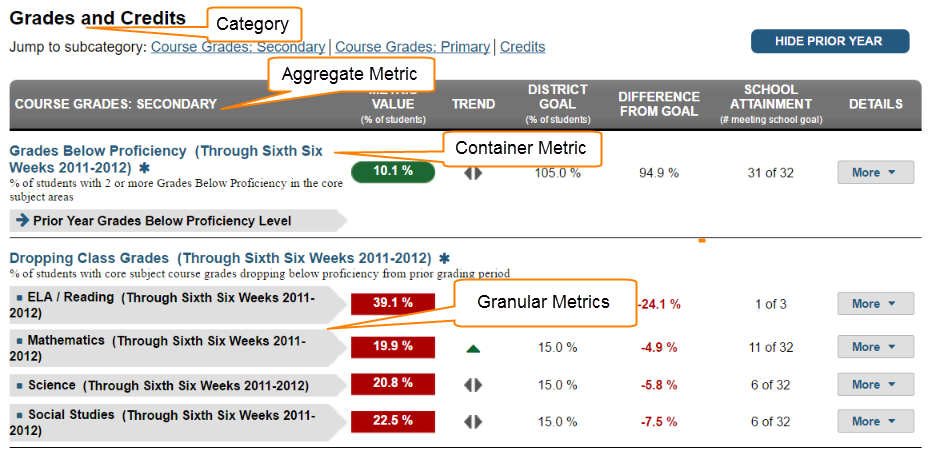
Aggregate, Container, and Granular Metrics
Each category of metric contains Aggregate, Container, and Granular metrics. In general, calculations are performed at the container and/or granular level. This is reflected in the metric configuration navigation.