The Ed-Fi “Classic Dashboards” are no longer supported through the Ed-Fi Alliance. You can still receive support and maintenance through the Ed-Fi vendor community. Please look at any of the vendors’ dashboard solutions on the Registry of Ed-Fi Badges or the Ed-Fi Starter Kits if you are looking for a visualization solution to use with the Ed-Fi ODS. This documentation will remain available to assist existing Classic Dashboard implementers.
ETL Developers' Guide - Dashboard Metric Configuration
The ETL Application uses metadata to drive the structure and organization of the metrics, and metadata plays a significant role in the processing done by the Translators. The as-shipped Ed-Fi Dashboards contain metadata that represents a "typical" organization, but most implementers find it useful to customize the metrics for their own environment.
This section outlines the basics of working with metric metadata, along with pointers to additional information.
Metric Goals
In the context of the Ed-Fi Dashboards, metric goals define whether a calculated metric (e.g., average daily attendance rate), meets a specified performance level (e.g., 95%). This in turn helps the Dashboard system to determine whether or not a metric calculation result is considered positive (in the sense of being considered "good").
While the dashboard application provides default goal values for metric calculations, it also allows implementations to update metric goals via the UI. The values shown in these pages are the default values provided in the dashboard application database metric.MetricState table.
Default Goals
For the ETL, the default goal configuration values are located in the \Edfi.Common\Enumerations\Metric.cs file. Each metric enumeration class specifies the metric ID, metric name, default goal value, and metric trend direction.
| Value | Description |
|---|---|
| metricId | The metricId is used in the translators for writing the correct metric ID to metric instances in the Dashboard DS and DW. |
| metric name | The metric name gives a meaningful description to the metric ID and is not used elsewhere in the application. |
| default goal | The default goal value is value used for metric goal when a dashboard.EducationOrganizationGoal record does not exist for the school or local education agency. |
| value | Default goal value, inclusive |
| metric trend direction | The metric trend direction specifies if the metric is a positive or negative trend (Ex: Student Tardy Rate is a negative trend when the metric value is greater than 10% it is considered a bad metric state. Student Daily Attendance is a positive trend, when the metric value is less than 90% it is considered a bad metric state). |
The values used in this file should match the default value data available in the dashboard database metric.MetricState table. This table is mainly used by the Dashboard UI and it was the original place for default goals prior to v2.0 of the Ed-Fi Dashboards.
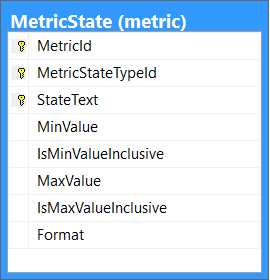
| Value | Description |
|---|---|
| MetricId | The metricId to which the default goal belongs. |
| MetricStateTypeId | Default metric state to render when the metric value falls in the range provided and the state is not provided by the ETL. |
| StateText | The StateText is the default text for the metric state display. The UI component does take an override, which is usually the metric value. If the override is not supplied, this default text is shown. For the UI metric state component, the state text is always shown as the tool-tip. |
| MinValue | The minimum default value for the selected metric state type. |
| IsMinValueInclusive | The IsMinValueInclusive flag denotes if the provided MinValue should be included in the range. |
| MaxValue | The maximum default value for the selected metric state type. |
| IsMaxValueInclusive | The IsMaxValueInclusive flag denotes if the provided MaxValue should be included in the range. |
Format | The format column has been deprecated, the value from the metric state is no longer used in the UI . |
While the MetricState default table allows for more complex goal configuration, the inherent assumption for metric goals is that they are inclusive and only one value (Min or Max) will be provided depending on the metric trend direction.
Custom Goals
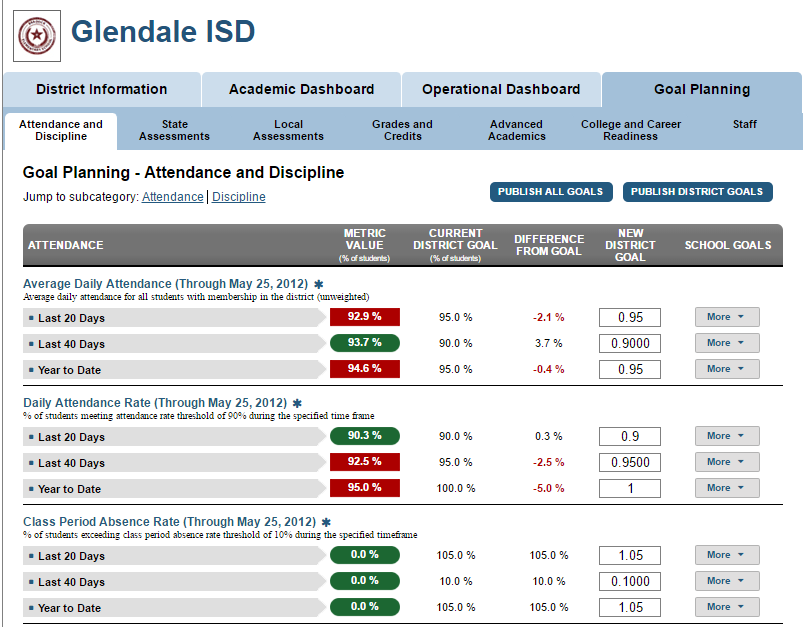
The district and school goals can be updated in in the Goal Planning page:
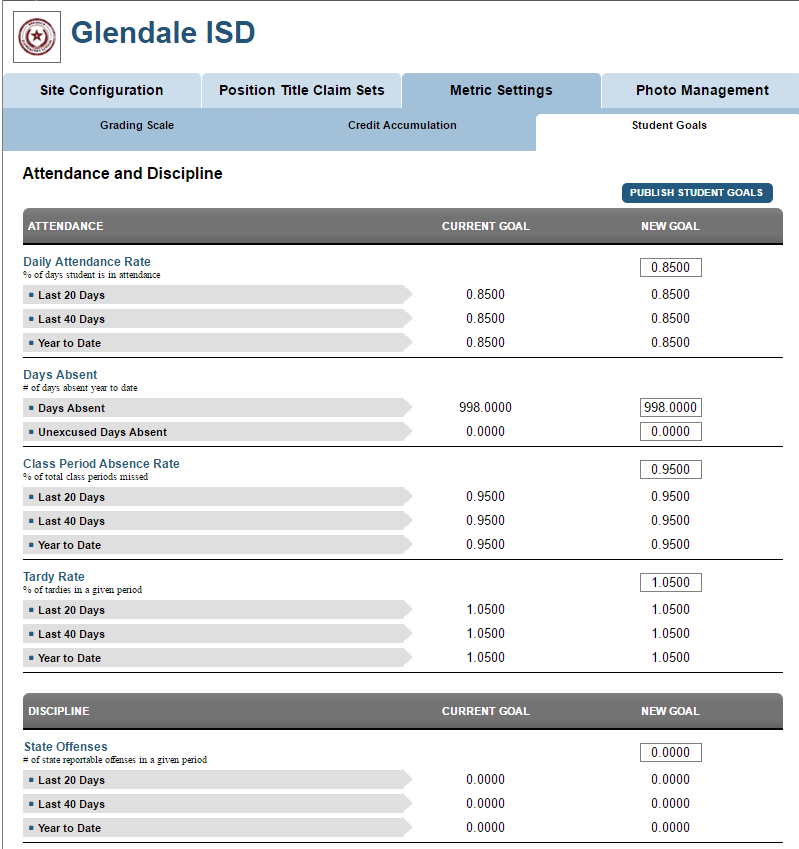
A system administrator can update student-level goals under the Metric Settings tab:
When goals are updated and published, the updated metric goals will be recorded in the dashboard.EducationOrganizationGoal table in the Application database. Goals are either defined at the school or district level. The EducationOrganizationId can either be an LEA ID or School ID. Goals are not defined at the individual student level, rather, student goals are defined at the school level and applied to all students in the school.
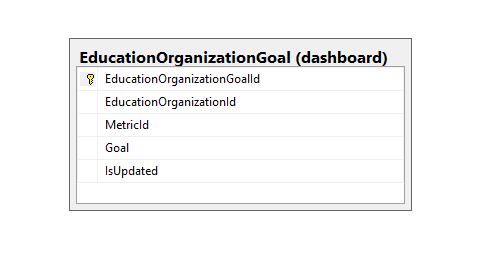
It is recommended that goals are configured through the Dashboard UI as opposed to editing this table directly.
Metric Goal
The metric.MetricGoal table in the Dashboard database is populated by the ETL Application which defines the goal used in the metric calculation for each student, school, and district by individual metric ID.
Grading Scales
Grading scales connect letter grades and descriptions (e.g., "B", "Good") to numeric calculations based on the upper numeric grade for a threshold (e.g., 89.00).
In the Ed-Fi Dashboards v3.1, student grade metric calculations require that an appropriate grading scale be configured. Grading scales can be added and configured through the Dashboard UI by any user that has access to Metric Settings.
It is recommended that grading scales are configured through the Dashboard UI Customizing the Grading Scale Metrics as opposed to editing these tables directly.
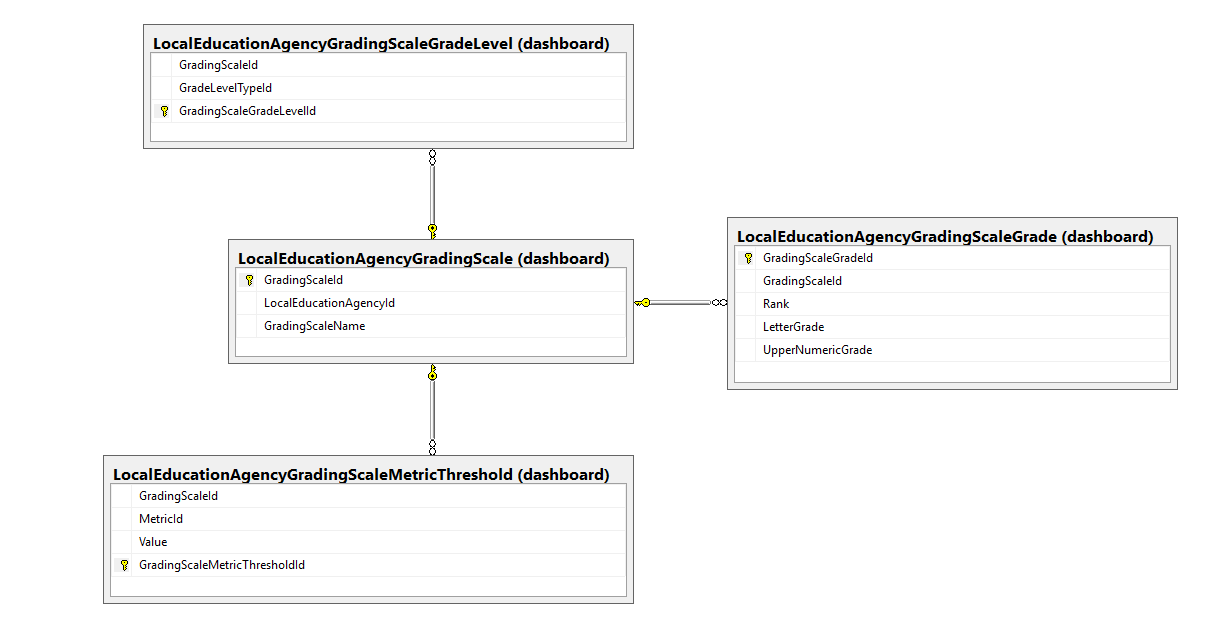
A brief description of each table follows:
- dashboard.LocalEducationAgencyGradingScale. Ties a grading scale to a local education agency.
- dashboard.LocalEducationAgencyGradingScale. Ties a grading scale to 1 or more grade levels.
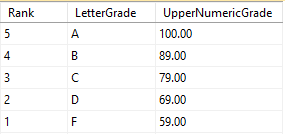
- dashboard.LocalEducationAgencyScaleGrade. Provides the ranking system for letter grades and percentage grades. The rank is numbered from 1 with the lowest letter/percentage grade to the determined highest letter/percentage grade. For example, if the grading scale is A,B,C,D,F, F will have the rank of 1, D with a rank of 2, etc. The percentage grades are configured with the UpperNumericGrade, for example, for a range of 100-90%, then from 89-80%, and so forth. The 100-90% record will have the UpperNumericGrade of 100 and the 89-80% record will have an UpperNumericGrade of 89.
- dashboard.LocalEducationAgencyScaleGrade. This table holds the grading scale grade rank thresholds for a metric. For example, the failing grades metric will have threshold of 2 which counts letter grades D and F as failing grades in the metric calculation.
Algebra Course Level Mapping
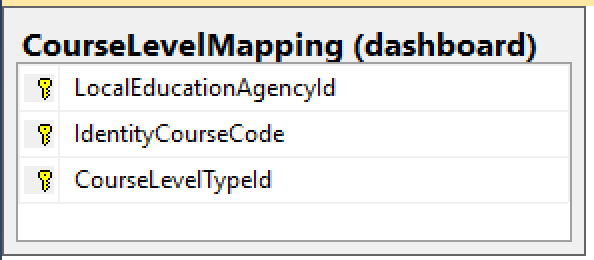
The dashboard.CourseLevelMapping table in the Application DB drives the Algebra-related metric calculations by identifying the Algebra Courses in the ODS. The mapping is per local education agency and by the course's CourseCode. The CourseLevelTypeId identifies the course as an Algebra I, Algebra II, Pre-Calc, or Algebra I Series course and the types are counted as an Algebra course in the metric calculation.
At the time of this writing, the dashboard.CourseLevelMapping table can only be configured through SQL scripts. It cannot be configured through the UI.
Below is a script that can be used as a starting point for populating this table:
Assessment Metadata Configuration
The Ed-Fi Dashboard data model is based on the Ed-Fi Data Standard, which has a robust data model for Assessments. The data model can convey a wide range of assessment information, from a simple quiz to a complex statewide standardized test, to national-level assessments like the SAT and ACT exams. The data model contains information about the general structure and scoring of assessments to the detailed results for individual students.
Assessment metrics in the Dashboards can be configured without custom programming using Assessment Metadata. This is a broad topic. Details for configuring assessments is located on the Assessment Metadata Configuration Details page.